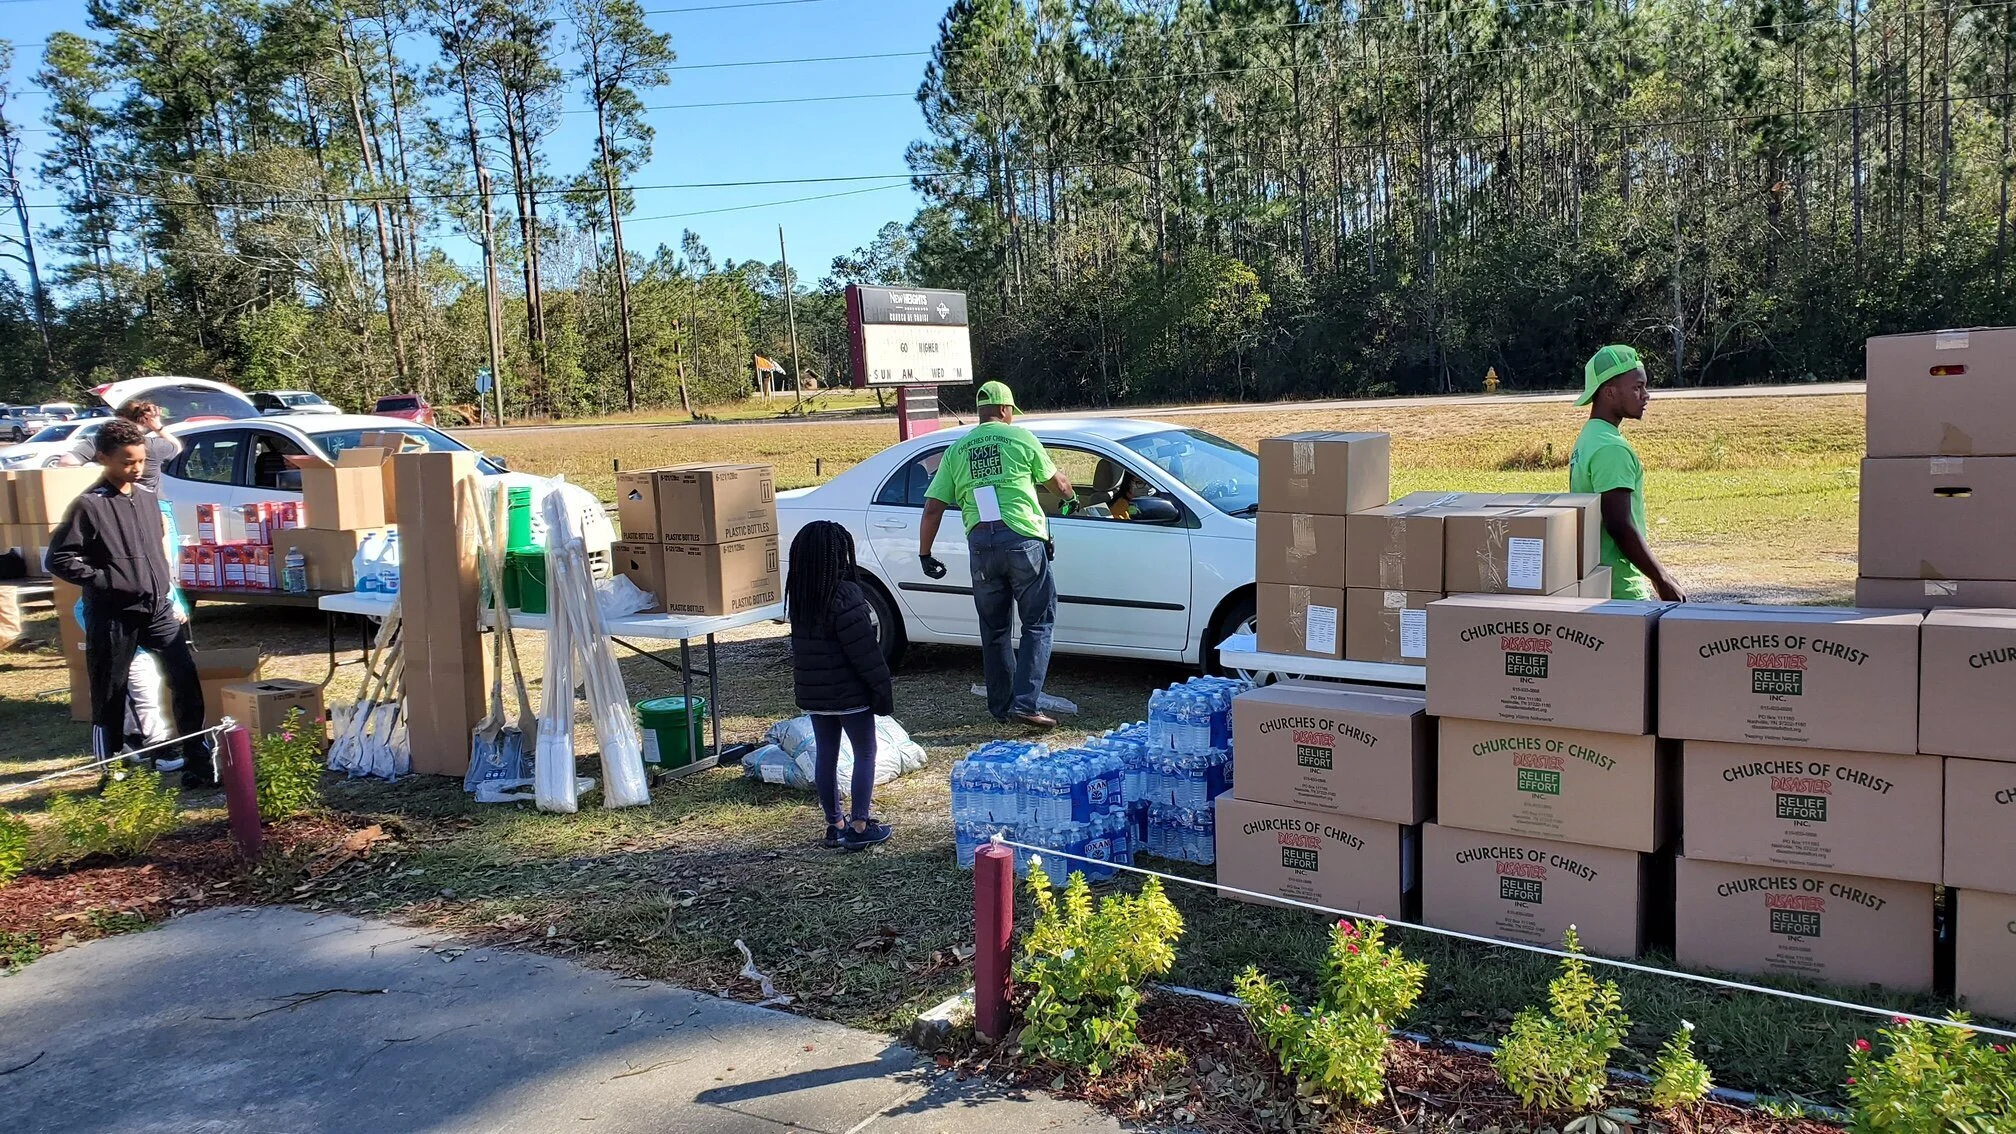
History of places served
2024 Involvement
Through December 31, 2024
From January 1st through December 31 of this year, aid has been sent to 72 communities/townships in 19 States, a total of 232 Shipments. Listed below are the states helped, and the retail value of the supplies given to the disaster victims by a local or nearby Church of Christ.
2023 Involvement
From January 1 through December 30th of this year, aid has been sent to 54 major disaster areas in 17 States, a total of 147 Shipments. Listed below are the states helped, and the retail value of the supplies given to the disaster victims by a local or nearby Church of Christ.
Alabama $ 227,150.57
Arkansas $ 558,905.15
California $ 37,174.00
Florida $ 505,729.20
Georgia $ 396,553.95
Hawaii $ 11,378.93
Indiana $ 72,626.28
Kentucky $ 452,092.51
Louisiana $ 409,186.32
Mississippi $ 565,765.72
Missouri $ 107,319.42
Ohio $ 20,059.00
Oklahoma $ 74,086.45
Tennessee $ 670,872.56
Texas $ 655,494.42
Vermont $ 428,840.02
Virginia $ 2,966.18
Other $ 10,870.80
TOTAL $5,207,071.48
2022 Involvement
Total Value of Supplies Given to Disaster Survivors by State from January 1 to December 31, 2022
16 STATES - 52 TOWNSHIPS/COUNTIES - 250 SHIPMENTS
ALABAMA $144,804.00
ARKANSAS $173,852.75
CALIFORNIA $77,213.77
COLORADO $79,082.99
FLORIDA $1,012,001.96
GEORGIA $114,792.05
KANSAS $80,291.04
KENTUCKY $1,559,683.15
LOUISIANA $3,294,197.52
MICHIGAN $74,911.02
MISSISSIPPI $64,438.47
NEW MEXICO $78,583.65
OKLAHOMA $82,458.94
TENNESSEE $664,737.09
TEXAS $206,067.16
VIRGINIA $238,975.32
OTHER $24,740.88
TOTAL $ 7,970,831.26
2021 Involvement
10 STATES - 30 TOWNSHIPS - 93 SHIPMENTS
Total Value of Supplies Given to Disaster Survivors by State in 2021
January – December 31, 2021
13 STATES - 59 TOWNSHIPS - 199 SHIPMENTS
ALABAMA $684,915.36
ARKANSAS $341,361.68
CALIFORNIA $205,662.87
FLORIDA $22,778.91
GEORGIA $241,775.39
KENTUCKY $1,553,633.96
LOUISIANA $2,457,541.76
MISSISSIPPI $12,240.00
MISSOURI $124,911.63
NEW JERSEY $71,568.08
NORTH CAROLINA $88,860.03
TENNESSEE $914,749.23
TEXAS $449,456.06
OTHER $4,076.10
TOTAL $ 7,13,551.46
Click here for a detailed reportClick here for a detailed report
2020 Involvement
131 Shipments to 40 Townships in 16 States
Total Value of Supplies Given to Disaster Survivors by State
January – December 2020
157 Shipments to 43 Townships in 17 States
Alabama $456,983.89
Arkansas $176,428.61
California $75,769.08
Florida $296,374.48
Iowa $79,037.48
Kentucky $67,843.79
Louisiana $1,319,460.44
Michigan $87,571.39
Mississippi $496,896.07
Missouri $227,555.87
Nebraska $38,896.88
Oklahoma $14,753.84
Oregon $246,702.99
South Carolina $71,016.43
Tennessee $504,864.09
Texas $473,557.61
Washington $149,249.80
Other $50,772.05
Total $4,833,824.79
2019 Involvement
352 Shipments to 47 Townships in 17 States
Total Value of Supplies Given to Disaster Survivors by State
352 Shipments to 47 Townships in 17 States
Alabama $150,134.11
Arkansas $208,042.60
California $74,794.28
Florida $1,180,415.12
Georgia $212,822.28
Illinois $7,579.00
Iowa $3,780.00
Louisiana $426,617.38
Mississippi $255,733.45
Missouri $361,298.72
Nebraska $1,466,271.18
North Carolina $819,641.51
Ohio $274,070.20
Oklahoma $1,041,622.70
South Carolina $1,617.00
Tennessee $282,587.60
Texas $799,493.23
OTHER $77,085.14
TOTAL $7,643,905.50
2018 Involvement
235 Shipments to 62 Townships in 21 States or US Territories
235 Shipments to 62 Townships in 21 States or US Territories
Total Value of Supplies Given to Disaster Survivors by State
Alabama $84,354.22
California $549,294.77
Colorado $89,177.92
Florida $2,359,133.31
Georgia $424,473.52
Hawaii $7,500.00
Illinois $83,161.27
Iowa $338,272.29
Indiana $120,140.14
Kansas $96,552.84
Kentucky $4,200.00
Louisiana $313,416.84
Michigan $112,443.70
Mississippi $21,896.23
North Carolina $2,121,681.60
Pennsylvania $1,578.98
South Carolina $413,900.29
Tennessee $32,788.40
Texas $1,870,023.80
West Virginia $3,661.48
US Virgin Islands $74,639.66
Other $2,431.00
TOTAL $9,116,771.78
2017 Involvement
Total Value of Supplies Given by State to Disaster Survivors in 2017
Arkansas $215,980.06
California $294,669.62
Florida $1,460,805.88
Georgia $374,777.51
Illinois $463,068.76
Louisiana $1,269,485.71
Mississippi $1,085,283.02
Missouri $1,084,837.58
North Carolina $177,640.41
Oklahoma $106,153.68
Pennsylvania $19,658.78
South Carolina $9,857.94
Tennessee $200,392.25
Texas $3,902,596.21
Puerto Rico $86,637.50
US Virgin Islands $71,807.96
Other $14,026.00
TOTAL $10,825,852.87
2016 Involvement
Total Value of Supplies Given by State to Disaster Survivors in 2016
Alabama $554,576.95
Arkansas $68,061.84
California $78,536.72
Florida $605,677.78
Georgia $85,198.12
Illinois $211,573.55
Indiana $73,274.83
Kansas $93,218.46
Louisiana $4,486,239.04
Michigan $112,248.00
Mississippi $667,192.77
Missouri $93,081.00
North Carolina $1,650,483.32
Oklahoma $71,158.08
Pennsylvania $110,131.66
South Carolina $444,917.34
Tennessee $195,140.87
Texas $2,993,268.95
Virginia $85,467.20
West Virginia $529,649.26
Other $24,806.94
TOTAL $13,233,902.68
2015 Involvement
Total Value of Supplies Given – By State
Alabama $154,413.21
Arkansas $262,087.27
California $243,859.38
Florida $248,788.61
Idaho $86,465.03
Illinois $329,167.58
Indiana $89,246.52
Kentucky $77,640.22
Louisiana $337,535.71
Mississippi $140,497.40
Missouri $284,938.44
Nebraska $324,825.72
New Mexico $9,000.00
Oklahoma $258,308.82
South Carolina $1,617,723.93
Tennessee $103,875.11
Texas $1,313,275.29
Utah $12,600.00
Washington $101,183.99
West Virginia $81,954.65
Other $2,041.38
TOTAL $6,079,428.36
2014 Involvement
Total Value of Supplies Given – By State
Alabama $421,236.09
Arkansas $205,084.42
California $135,127.04
Colorado $43,609.00
Florida $297,919.67
Illinois $701,418.44
Louisiana $159,543.25
Mississippi $283,995.81
Nebraska $308,700.79
New York $49,729.25
Ohio $70,721.35
Oklahoma $190,905.68
Tennessee $92,907.22
Washington $104,072.82
West Virginia $525,720.91
Other $28,421.97
Total Value of Supplies $3,619,113.71
2013 Involvement
Total Value of Supplies Given – By State
Alabama $14,577.00
Arizona $145,075.27
Colorado $601,336.30
Florida $246,182.50
Georgia $274,929.27
Illinois $676,955.71
Indiana $85,944.98
Louisiana $248,033.86
Mississippi $544,875.83
New Jersey $1,056,866.99
New Mexico $22,742.00
New York $761,935.25
Oklahoma $936,506.44
Tennessee $339,110.90
Texas $983,079.32
Other $1,460.23
Total Value of Supplies $6,939,611.85
2012 Involvement
Total Assistance Given
Alabama $373,869.56
Colorado $184,335.10
Connecticut $83,973.27
Florida $477,102.73
Illinois $96,241.00
Indiana $197,474.35
Kansas $144,271.92
Kentucky $333,734.55
Lousiana $1,055,194.93
Minnesota $88,345.32
Missouri $145,499.93
Nebraska $100,942.25
New Jersey $821,331.69
New Mexico $97,052.62
New York $1,044,570.10
North Carolina $76,730.00
North Dakota $110,095.00
Ohio $115,567.40
Oklahoma $213,007.77
Tennessee $197,919.90
Texas $444,236.71
West Virginia $98,337.73
Other $36,065.70
Totals $6,535,899.61
2011 Involvement
Total Assistance Given by State to Disaster Survivors in 2011
Alabama $2,384,824.70
Arizona $77,556.52
Arkansas $83,785.12
Connecticut $85,109.72
Georgia $85,080.82
Kansas $81,021.82
Kentucky $221,994.29
Louisiana $145,892.00
Massachusetts $457,411.84
Mississippi $116,943.22
Missouri $1,000,046.04
New Jersey $252,264.96
New York $192,172.32
North Carolina $758,117.24
North Dakota $102,888.52
Oklahoma $307,552.64
Pennsylvania $397,622.68
South Dakota $215,408.96
Tennessee $541,598.30
Texas $352,941.87
Vermont $569,078.32
Virginia $461,889.55
Other $110,269.20
Total $9,001,470.65


